
A good employee engagement survey asks 25 to 40 statements, each rated on a five-point scale from Strongly disagree to Strongly agree, grouped by the drivers that move engagement: role clarity, the manager, growth, recognition, pay, workload, belonging, leadership and tools. Add one eNPS question and two open questions. Report only groups with at least five responses, and give people the results and an action plan within 30 days. Below you will find 45 questions ready to use, a scoring method worked through with numbers from a Pune manufacturer, and what Indian employers have to plan for: shop-floor and field staff, regional languages and data protection.
As at 19 November 2026. The scoring rules here are common practice and no law sets them. Nothing here is legal advice.
| Item | Working rule | Basis | Section |
|---|---|---|---|
| Annual survey length | 25 to 40 statements, 10 to 15 minutes | Common practice | 2 |
| Pulse survey | 5 questions, every quarter | Common practice | 2, 6 |
| Scale | Five points, every point labelled in words | Common practice | 3, 4 |
| Item score | Favourability: % Agree plus % Strongly agree | Common practice | 4 |
| eNPS | % scoring 9 or 10 minus % scoring 0 to 6; range -100 to +100 | Standard eNPS method | 4 |
| Smallest group you report | 5 responses | Common practice | 3, 4 |
| Response rate | Aim for 70%; read anything under 50% with caution | Common practice | 4 |
| Survey window | At least 10 working days, so every shift rotation is covered | Common practice | 3, 6 |
| Results back to employees | Within 30 days of closing | Common practice | 6 |
| Legal duty to run a survey | None | 5 | |
| Answers linked to an employee code | Personal data. Notice, purpose and erasure duties apply from 13 May 2027 | DPDP Act, 2023, s.2(t), 5, 7, 8; G.S.R. 843(E) | 5 |
| Grievance Redressal Committee | Industrial establishments with 20 or more workers; up to 10 members, half from each side | Industrial Relations Code, 2020, s.4 | 5 |
What does an employee engagement survey measure?
Engagement is how committed people are to their work and to the company: whether they put in extra effort, plan to stay and would recommend the place to a friend. Satisfaction is narrower. It asks whether people are content with pay, facilities and policies. Someone can be satisfied and still disengaged, so a useful survey measures both and looks at the gap. Our glossary entries on employee engagement and employee satisfaction explain the difference in more depth.
Five terms come up in the rest of this guide:
- Driver: a theme that moves engagement, such as manager support or career growth. Questions are grouped by driver so you know what to fix.
- Outcome questions: the four items that measure engagement itself: pride, intent to stay, extra effort and seeing a career here. Driver scores are read against these.
- Favourability: the share of people who answer Agree or Strongly agree on a five-point scale.
- eNPS (employee Net Promoter Score): % promoters (9 or 10) minus % detractors (0 to 6) on a 0 to 10 "would you recommend" question. See our eNPS glossary entry.
- Pulse survey: a short survey of 5 to 10 questions run monthly or quarterly between full surveys.
No survey raises engagement by itself. What it gives you is a number for each team and site that you can track, and a list of the few things people most want changed.
45 employee engagement survey questions, grouped by driver
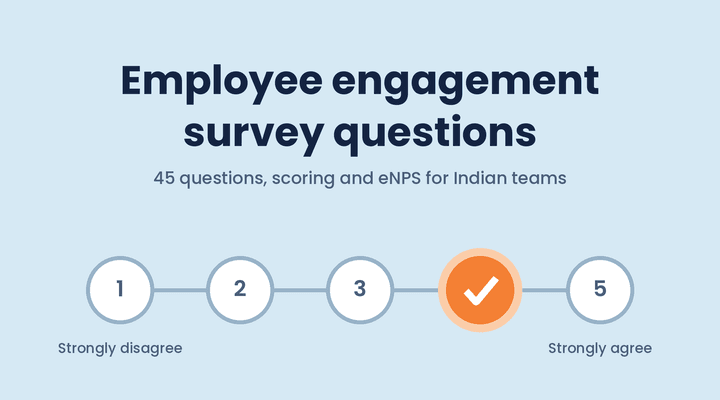
Use these as statements on a five-point scale: Strongly disagree, Disagree, Neutral, Agree, Strongly agree. Pick 25 to 40 for an annual survey. Keep all four outcome questions every time so the trend stays comparable year on year. The wording is deliberately plain because it has to survive translation into Hindi, Marathi, Tamil or Kannada.
| # | Driver | Statement |
|---|---|---|
| 1 | Outcome | I am proud to tell people where I work. |
| 2 | Outcome | I see myself working here two years from now. |
| 3 | Outcome | I am willing to put in extra effort when the team needs it. |
| 4 | Outcome | This is a good place to build a career. |
| 5 | Role clarity | I know what is expected of me at work. |
| 6 | Role clarity | My targets or KRAs for this year are clear to me. |
| 7 | Role clarity | I have the information I need to do my job well. |
| 8 | Role clarity | I understand how my work contributes to the company's results. |
| 9 | Role clarity | I get to use my skills in my current role. |
| 10 | Manager | My manager gives me useful feedback on my work. |
| 11 | Manager | My manager treats everyone in the team fairly. |
| 12 | Manager | I can raise a problem with my manager without fear. |
| 13 | Manager | My manager cares about me as a person. |
| 14 | Manager | My manager helps me remove obstacles in my work. |
| 15 | Growth and learning | I have learnt something new at work in the last six months. |
| 16 | Growth and learning | Someone here has talked to me about my career in the last year. |
| 17 | Growth and learning | Promotions here go to the people who deserve them. |
| 18 | Growth and learning | I get the training I need to do my job well. |
| 19 | Recognition | When I do good work, it gets noticed. |
| 20 | Recognition | Recognition here is shared fairly across the team. |
| 21 | Recognition | My performance rating last cycle reflected my actual work. |
| 22 | Recognition | Senior leaders appreciate the work done at my location. |
| 23 | Pay and benefits | My salary is fair for the work I do. |
| 24 | Pay and benefits | My salary is credited on time and correctly every month. |
| 25 | Pay and benefits | I understand how my salary, PF and other deductions are calculated. |
| 26 | Pay and benefits | Leave and reimbursement requests are processed without delay. |
| 27 | Pay and benefits | Our benefits (insurance, leave, allowances) meet my needs. |
| 28 | Workload and wellbeing | My workload is manageable most weeks. |
| 29 | Workload and wellbeing | I can take leave when I need it without feeling guilty. |
| 30 | Workload and wellbeing | My shift timings or working hours let me manage my life outside work. |
| 31 | Workload and wellbeing | I rarely have to work after hours to finish my regular work. |
| 32 | Workload and wellbeing | The company takes employee health and stress seriously. |
| 33 | Belonging and respect | People here treat each other with respect, whatever their level. |
| 34 | Belonging and respect | I feel I belong in my team. |
| 35 | Belonging and respect | I can be myself at work. |
| 36 | Belonging and respect | If I faced harassment or unfair treatment, I know where to report it. |
| 37 | Belonging and respect | I trust that complaints are handled fairly here. |
| 38 | Leadership and communication | I trust the decisions made by senior leadership. |
| 39 | Leadership and communication | I hear about important changes from the company before I hear rumours. |
| 40 | Leadership and communication | Leadership has a clear plan for the company's future. |
| 41 | Leadership and communication | When we gave feedback in the last survey, something changed. |
| 42 | Tools and safety | I have the tools, equipment and system access I need. |
| 43 | Tools and safety | I feel safe at my workplace, including during night shifts. |
| 44 | Tools and safety | Safety rules are followed even when production targets are tight. |
| 45 | Tools and safety | HR systems (attendance, leave, payslips) are easy for me to use. |
Add these three to every survey:
- eNPS: "On a scale of 0 to 10, how likely are you to recommend this company as a place to work to a friend or relative?"
- Open question 1: "What is one thing we should keep doing?"
- Open question 2: "What is one thing we should change first?"
For a five-question pulse survey, use Q2, Q10, Q28, Q41 and the eNPS question. Each quarter, swap one item for the driver you are working on.
Q41 deserves attention. When people feel nothing changed after the last survey, fewer of them answer the next one and the comments get sharper. Q24 to Q26 tie straight to HR operations. A low score there usually points to a payroll or leave-process problem that can be fixed within one cycle, and our posts on the payslip format and common payroll errors are a good place to start. Q21 picks up unease about ratings, which our bell curve appraisal guide covers from the manager's side.
How do you survey plant, field and shift staff in India?
Most survey templates assume everyone sits at a laptop and reads English. In a 600-person Indian company, half the workforce may be on a shop floor, in a warehouse or out on field visits. If the survey reaches only the office, the results describe only the office.
Languages. Offer the survey in English plus the main language of each site: Hindi in the north, Marathi at a Pune plant, Tamil in Chennai, Kannada in Bengaluru. Have each translation checked by a supervisor from that site as well as by the translator. Words such as "fair" and "recognised" can shift in meaning, and translating the survey back into English is a quick way to spot where they did.
Access. Send a mobile link or use an app for people with smartphones. For the rest, put a shared tablet or kiosk in the canteen or time office and let people log in with their employee code. Paper still works at small sites, but the responses should be entered by someone outside the line management.
Shift timing. Keep the survey open for at least 10 working days so it covers every shift rotation, and allow 15 minutes of paid time to fill it in. A night-shift operator asked to answer at the end of the shift will rush it.
Scale wording. Label every point on the scale in words as well as numbers. Some respondents avoid the extremes, so watch the Neutral share. When Neutral goes above about 30% on a question, people are often unsure or wary of answering, and it is worth a follow-up conversation with that group.
Timing in the year. Avoid the weeks just after appraisal ratings or increment letters go out (usually April to June for companies on an April to March year), because scores will mostly reflect that one event. Avoid Diwali and the March year-end close. August to September and January are usually quieter.
Trust. Hierarchy makes people careful about what they write. State in writing who will see the raw data (ideally only HR, or an outside party), that managers see only group results, and that no group with fewer than five responses gets its own report.
How do you score an engagement survey?
These are working rules most practitioners use. None of them is set by law.
| Rule | What to use | Why |
|---|---|---|
| Scale | Five points, every point labelled | Easy to translate and comparable year to year |
| Item score | Favourability = % Agree + % Strongly agree | Easier to explain to managers than an average such as 3.7 |
| Also report | % Neutral and % Unfavourable | An item at 50% favourable with 40% unfavourable needs different action from one with 40% neutral |
| Driver score | Average favourability of the items in that driver | Shows which theme to work on |
| eNPS | % scoring 9 or 10 minus % scoring 0 to 6 on a 0 to 10 scale. Those scoring 7 or 8 count in the total but in neither group | Gives a figure from -100 to +100 |
| Smallest group reported | No report for a group with fewer than 5 responses; merge it into the next level up | Protects anonymity in small teams |
| Response rate | Aim for 70% or more; read results below 50% with caution | A low rate can mean only the strongest views were recorded |
| Comparison | Your own trend first. Use an outside benchmark only if it used the same questions and scale | Scores depend on wording, scale and timing |
There is no reliable universal "good" eNPS. Track your own number over the same months each year, as our eNPS glossary entry explains.
Worked example 1: eNPS for a head office and a plant
A Pune auto-components maker has 420 employees: 140 at the head office and 280 at its Chakan plant. It runs the survey for 12 days in September, in English and Marathi.
| Location | Headcount | Responses | Response rate | Promoters (9 to 10) | Passives (7 to 8) | Detractors (0 to 6) | eNPS |
|---|---|---|---|---|---|---|---|
| Head office | 140 | 118 | 84.3% | 52 (44.1%) | 44 | 22 (18.6%) | +25.4 |
| Chakan plant | 280 | 192 | 68.6% | 44 (22.9%) | 70 | 78 (40.6%) | -17.7 |
| Company | 420 | 310 | 73.8% | 96 (31.0%) | 114 | 100 (32.3%) | -1.3 |
The company-wide eNPS of -1.3 averages two very different sites. The head office is broadly positive. The plant has more detractors than promoters, and a lower response rate as well. A CHRO who reports only -1.3 to the board has buried the plant problem in an average.
Worked example 2: favourability at the plant
Now take four of the plant's questions across its 192 responses. Counts run Strongly disagree / Disagree / Neutral / Agree / Strongly agree.
| Question | Counts (SD/D/N/A/SA) | Favourable | Neutral | Unfavourable |
|---|---|---|---|---|
| Q24 Salary credited on time and correctly | 3 / 6 / 15 / 80 / 88 | 87.5% | 7.8% | 4.7% |
| Q5 I know what is expected of me | 4 / 9 / 21 / 88 / 70 | 82.3% | 10.9% | 6.8% |
| Q10 My manager gives me useful feedback | 14 / 31 / 52 / 64 / 31 | 49.5% | 27.1% | 23.4% |
| Q2 I see myself here in two years | 22 / 38 / 61 / 50 / 21 | 37.0% | 31.8% | 31.2% |
Favourable for Q10 is (64 + 31) / 192 = 49.5%. Payroll and role clarity are working at this plant. Supervisor feedback is weak, and intent to stay is low, with almost a third unfavourable and another third neutral. The action plan belongs with the plant's line supervisors (feedback training and a monthly one-to-one), and payroll needs no change. Our glossary entry on continuous feedback covers what that monthly conversation can look like. If plant attrition is already rising, read Q2 next to your attrition rate and what leavers say in exit interviews. When you cut these results by shift, any shift with fewer than five responses is merged into the plant total.
Engagement surveys, the DPDP Act and the Industrial Relations Code
No Indian law requires an engagement survey. Two laws still shape how you run one. This is general information, so check the specifics with your counsel.
Digital Personal Data Protection Act, 2023. The Act treats any data about an individual who can be identified from it as personal data (section 2(t)), so survey answers linked to an employee code count. The duties to give notice, use data only for its stated purpose, keep it secure and erase it once the purpose is over (sections 5 to 8) come into force on 13 May 2027, 18 months after the government notified the commencement dates on 13 November 2025 (G.S.R. 843(E)). Section 7(i) lets an employer process personal data "for the purposes of employment" without consent. Whether a voluntary engagement survey falls within that is open to argument. A survey you design now will still be running after May 2027, so the simpler course is to build these in from the start:
- Make participation voluntary and say so on the first screen.
- Give a short notice: what you collect, why, who sees raw responses and how long you keep them.
- Collect only the demographics you will actually report on (location, department, tenure band). Leave out date of birth, religion and caste.
- Set a retention period for raw data (for example, until the next survey closes) and delete it after that.
- Keep survey answers out of appraisals and disciplinary files.
Industrial Relations Code, 2020. Every industrial establishment employing 20 or more workers must have one or more Grievance Redressal Committees, with an equal number of employer and worker members and no more than 10 members in all (section 4). A survey is no substitute for that committee. If an open comment describes a specific grievance, harassment or a safety hazard, tell people how to raise it: through the Grievance Redressal Committee, the Internal Committee under the POSH Act (our Internal Committee template covers its set-up) or the safety officer where you have one. An anonymous comment gives you nothing to investigate, so do not try to resolve the case from the comment alone. Our glossary entry on grievances explains how a formal grievance is handled.
Step by step: running your first engagement survey
- Set one goal. For example, "find out why plant attrition rose from 18% to 26%". The goal decides which drivers get the most questions.
- Pick 25 to 40 questions from the bank above, keeping the four outcome items, the eNPS question and both open questions.
- Decide the cuts you will report (location, department, shift, tenure band) and check that each is likely to get at least five responses.
- Translate and test. Run the survey with 8 to 10 people from different sites. Time it and aim for under 15 minutes.
- Write the notice: purpose, who sees what, how long raw data is kept and the five-response rule.
- Brief managers a week before. Tell them they will see group results only and that they will own an action plan.
- Launch and keep it open for 10 to 12 working days. Send reminders on day 3 and day 8. Share live response rates by location, never by name.
- Analyse favourability by item and driver, eNPS by location and the themes in the open comments. Look for the two or three drivers with the lowest scores and the most room to move.
- Share results within 30 days. Company results go to everyone; team results go to each manager and their team.
- Agree two or three actions per team, each with an owner and a date, and post them where people can see them.
- Run a pulse survey at 90 days with five questions, including the drivers you acted on.
- Repeat the full survey at the same time next year with the same core items.
New joiners are a group of their own. If your survey shows low scores for people with less than a year's service, look at the first 90 days, which our employee onboarding checklist walks through.
Common mistakes
- Running the survey and then going quiet. Trust drops fastest this way, and Q41 will show it next year.
- Reporting tiny groups. In a team of three, a 33% favourable score points to one person.
- Offering only an English survey on a desktop. You will hear from the office and miss the shop floor.
- Launching right after increment letters. You will end up measuring the increment.
- Changing the wording every year. The trend stops meaning anything.
- Treating the company average as the answer. Example 1 shows how an average hides a plant problem.
- Asking managers to "explain" low scores in front of their team. People stop being candid.
- Using survey responses in appraisals. Even the suspicion of it ends honest answers.
How HR software helps with engagement surveys
A spreadsheet or a free form tool can run one survey. The second and third rounds are harder: matching responses to locations and shifts without exposing names, keeping the trend and reaching people who do not use email. An HRMS already holds the employee master, so it knows who sits in which department, location and shift.
Engage, an HRMS for Indian companies with 50 or more employees, has an employee engagement module with pulse surveys, custom surveys and polls that are shared through a company feed, where employees answer directly. For custom surveys you can track participation and analyse results in one place. Employees can use the feed from the Engage Android and iOS apps. The same module carries company-wide announcements. Surveys sit in the same system as attendance, leave, payroll and learning and development, so HR can look at a low score on Q26 next to the leave records it already has, or a weak growth score next to training records.
FAQ
What are good employee engagement survey questions?
Statements people rate on a five-point scale, grouped by driver: role clarity, manager support, growth, recognition, pay and benefits, workload, belonging, leadership and tools. Add four outcome items (pride, intent to stay, extra effort and career), an eNPS question and two open questions.
How many questions should an employee engagement survey have?
25 to 40 for an annual survey, which takes 10 to 15 minutes. A pulse survey should have 5 to 10. Shop-floor and field staff are the first to drop out of a long survey.
What is the difference between employee engagement and employee satisfaction survey questions?
Satisfaction questions ask whether people are content with pay, facilities and policies. Engagement questions ask about commitment: pride, extra effort and intent to stay. Use both, because a satisfied but disengaged team is a retention risk.
How do you calculate eNPS?
Ask how likely employees are to recommend the company as a place to work, on a 0 to 10 scale. eNPS is the % who answer 9 or 10 minus the % who answer 0 to 6. With 118 responses, 52 promoters and 22 detractors, eNPS = 44.1% - 18.6% = +25.4.
Are employee engagement surveys anonymous?
They should at least be confidential: only HR or an outside party sees raw data, managers see group results, and no group with fewer than five responses is reported. Say this in writing before launch.
How often should you run an employee engagement survey?
Once a year for the full survey, with a five-question pulse every quarter. Do not survey more often than you can act on the results.
What is a good response rate for an employee survey?
Aim for 70% or more. Below 50%, treat the results as indicative only and check which locations or shifts did not respond.
To see what it would cost for your team size, check Engage pricing.
Sources
- Digital Personal Data Protection Act, 2023, sections 2(t), 5, 7(i) and 8, Ministry of Electronics and Information Technology.
- Notification G.S.R. 843(E) dated 13 November 2025, commencement dates for the DPDP Act, Ministry of Electronics and Information Technology.
- Digital Personal Data Protection Rules, 2025, G.S.R. 846(E), 13 November 2025, Ministry of Electronics and Information Technology.
- DPDP Rules, 2025 notified, Press Information Bureau, on the 18-month phased rollout.
- Industrial Relations Code, 2020, section 4 on Grievance Redressal Committees, Ministry of Labour and Employment.